Electronic Data Repository of Health Information Systems
User Manual
Data Repository of HIS © 2020
Table of Contents
Chapter 1: Introduction
An Integrated dashboard is developed that provides single sign-in and facilitate the managers at MOH to review the data from the linked MIS/databases on one screen. The managers could use the dashboard to see the analysis of desire health system with drilldown features. The drilldown in the dashboard would allow the managers to reach root cause of the issues easily. Following are the main dashboard design of the Electronic Data Repository of Health Information System for Ministry of Health Jordan.
1.1 Access and Login:
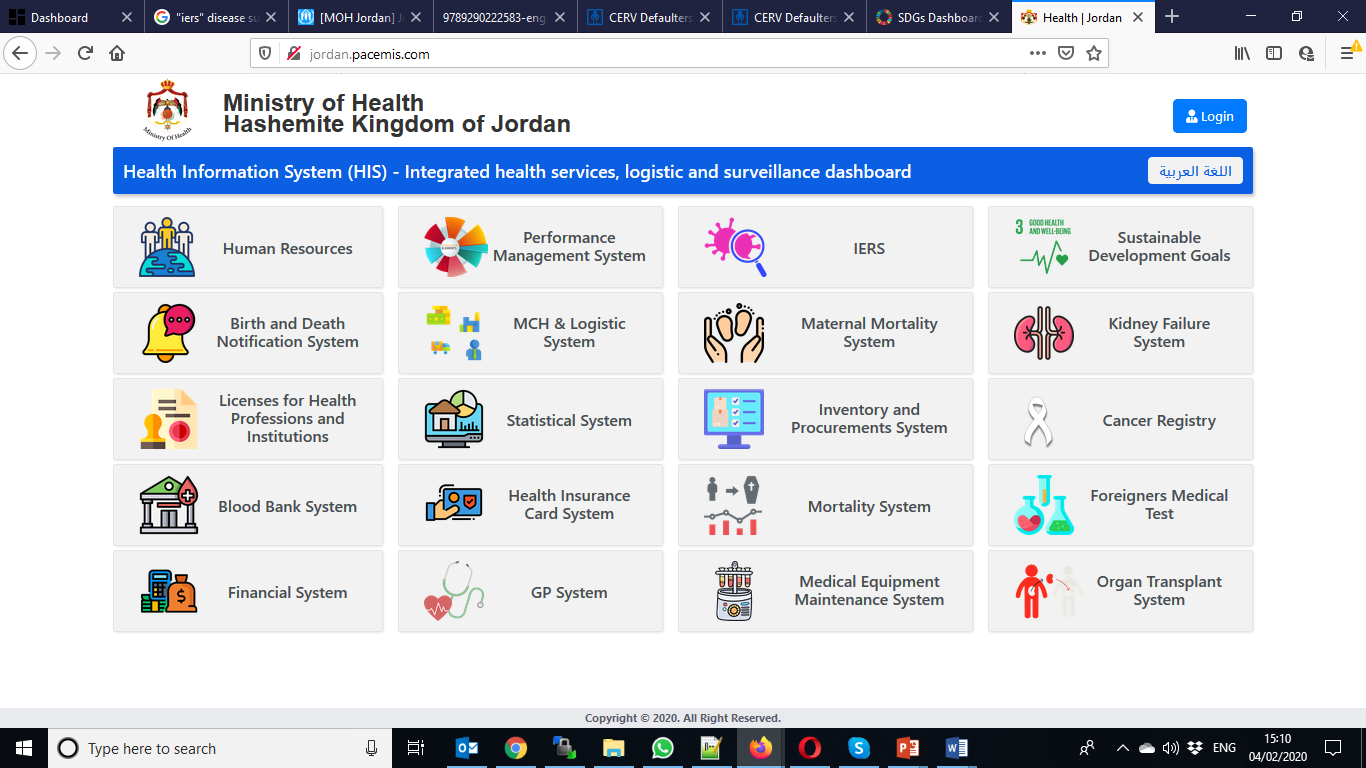
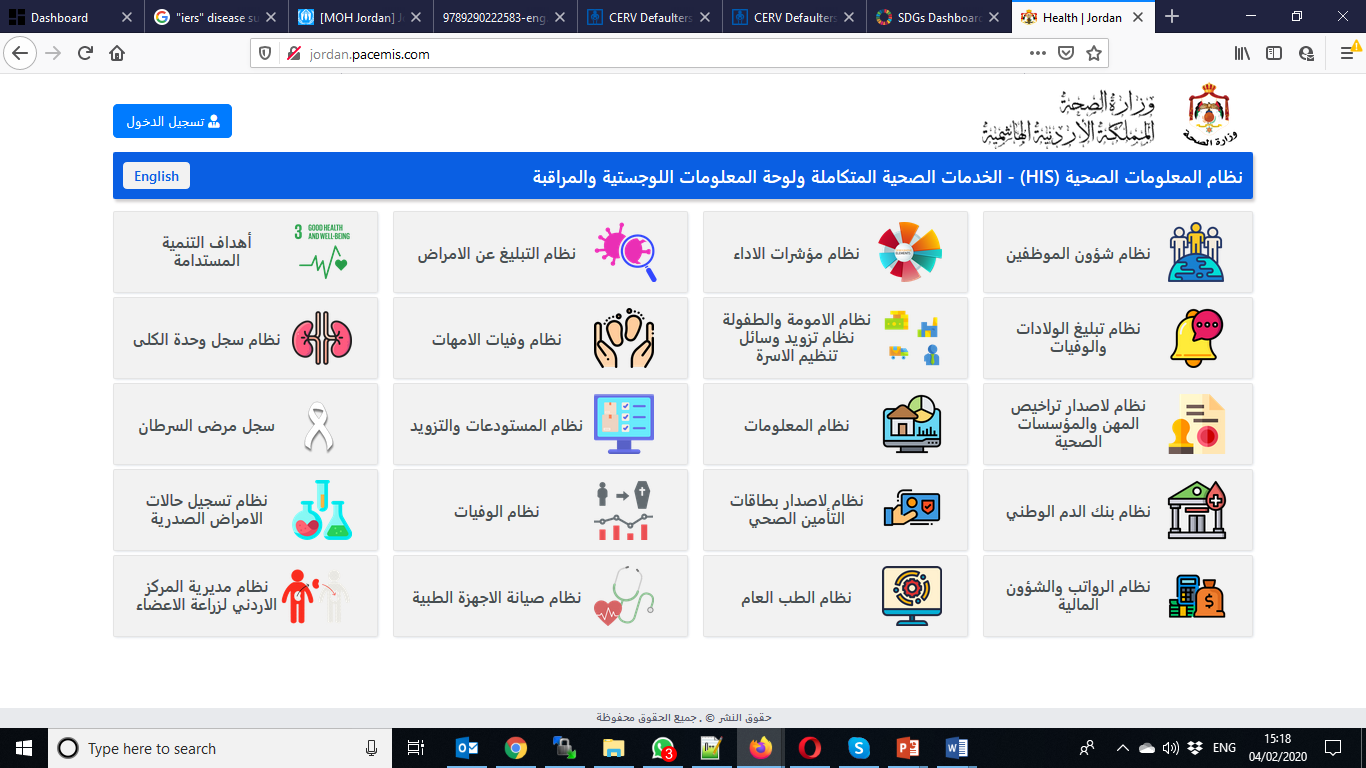
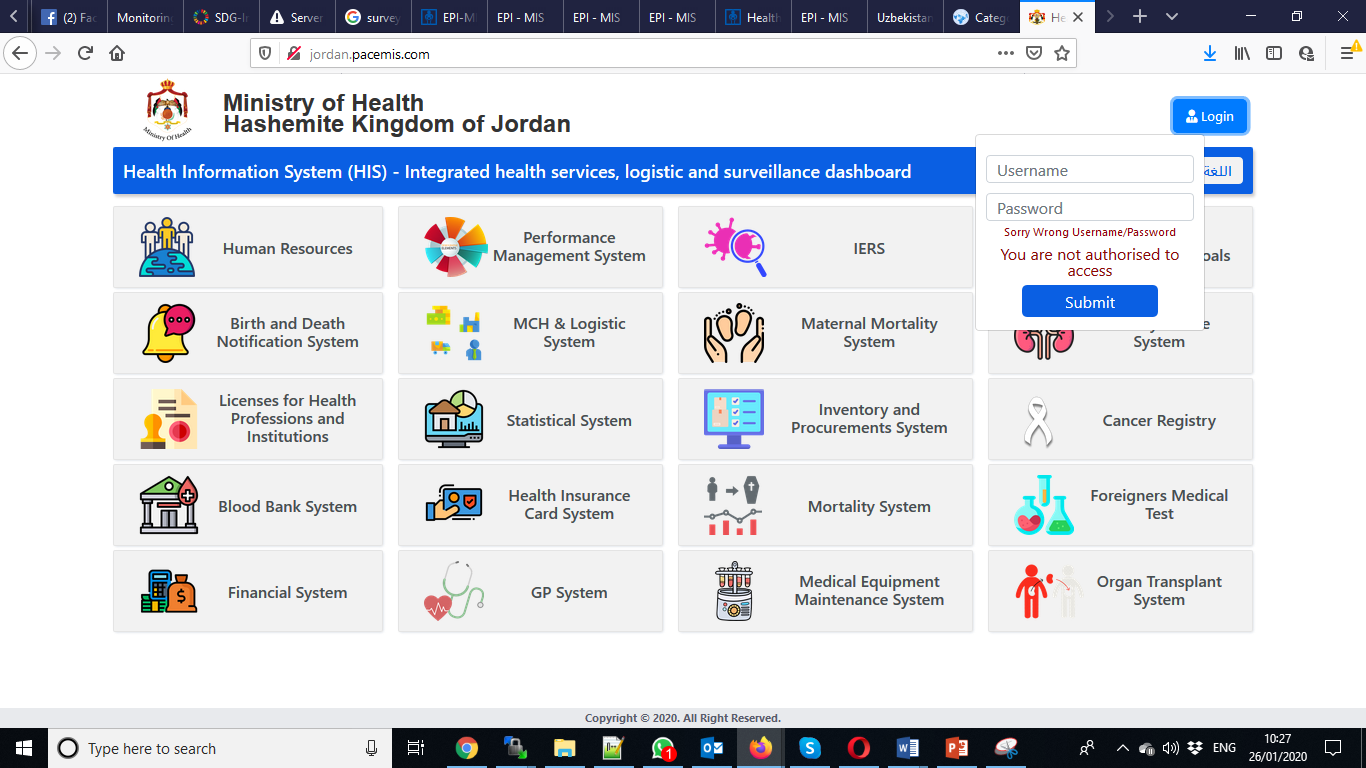
To open homepage of the system, the user must use any web browser (Internet Explorer, Mozilla Firefox, Google Chrome etc.). Click icon on desktop or click start menu and then click the icon for the web browser installed on the computer.

This will open a new browser window as shown in the figure below and here user can type the following address: http://jordan.pacemis.com in the address bar. Only authorized users can use this system, user needs to login on the system. Here user must enter his/her credentials and click on login button to get access to this system.
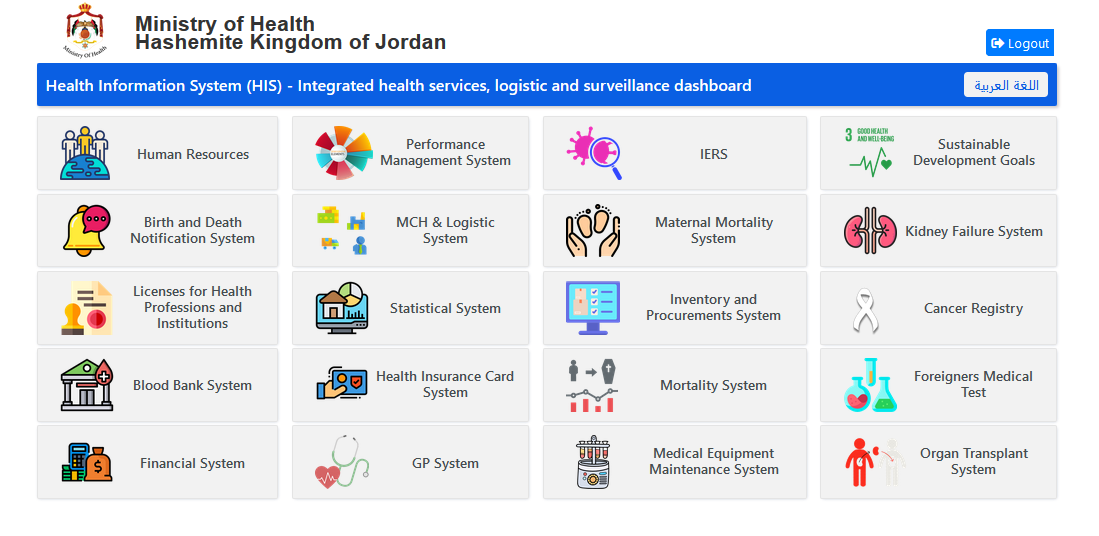
1.2 Main Interface/Home Page:


Chapter 2: SDG3 Data Repository
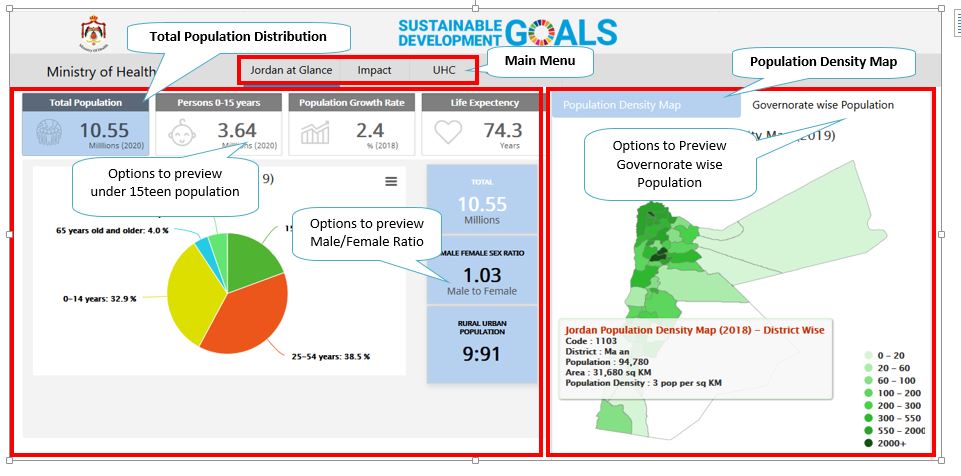
2.1 Jordan at Glance
The page show the basic information about the Jordan, e.g. total population, person under 15teen, population growth rate, life expectancy, region wise population density and governorate-wise population. It further provide us information about sex ratio, urban-rural population, age wise population bifurcation, total fertility rate, crude birth rate, crude death rate, life expectancy, number of child bearing-age women and productive age persons.
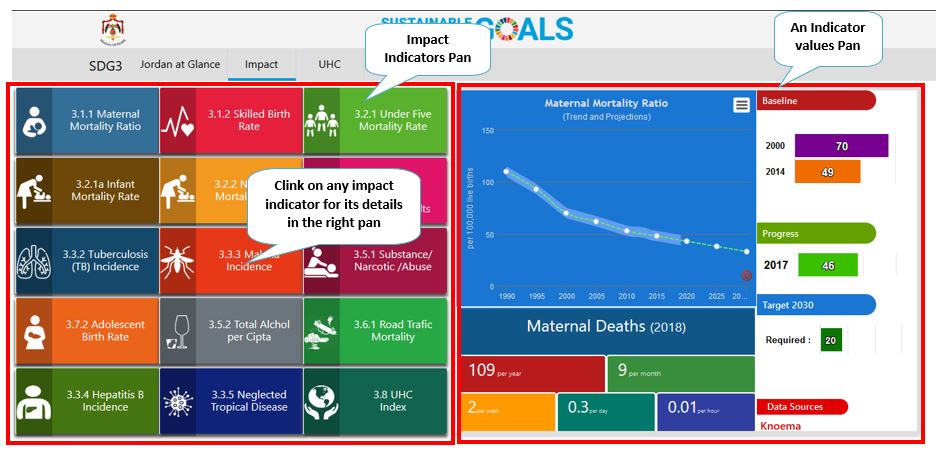
2.2 Impact Indicators
The page show the impact indicator of SDC in Jordan, e.g. Maternal Mortality Ratio, Skilled Birth Attendant Rate, under five mortality rate, infant mortality rate, neonatal mortality, etc. The left pan shows the indicators list and right pan provide us the details of an individual indicator.
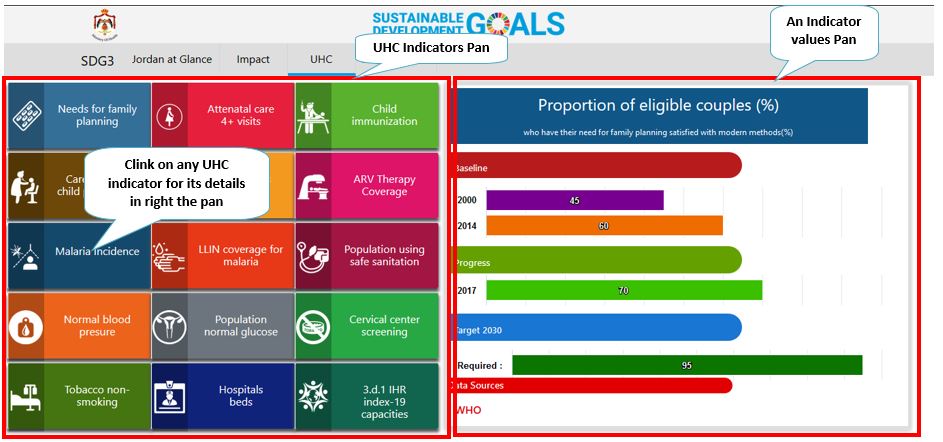
2.3 Universal Health Coverage Indicators
The page show the UHC indicators of Jordan, e.g. Needs for family planning, antenatal care, child immunization, etc. The left pan shows the indicators list and right pan provide us the details of an individual indicator.
Chapter 3: IERS System
IERS is a public health surveillance software for Ministry of Health, Jordan. It is tablet based system for reporting disease cases. The data repository extracted the data from JIERS by using the Application Programming Interfaces (APIs) and depicted on the dashboards. The dashboard have information about the health centers used in the JIERS, Disease surveillance line list and age-wise, gender-wise, sex-wise, governorate-wise bifurcation of the disease cases. Following are the details:
3.1 Main Menu
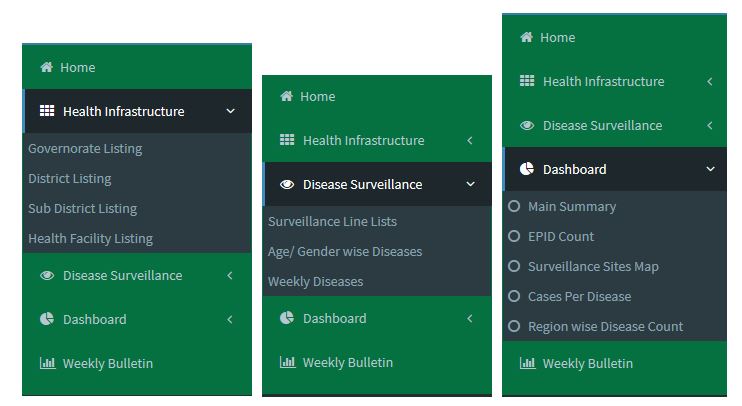
3.2 Health Infrastructure
The menu provide Governorate listing, district listing, sub-district listing and health center listings. Following are the further details:
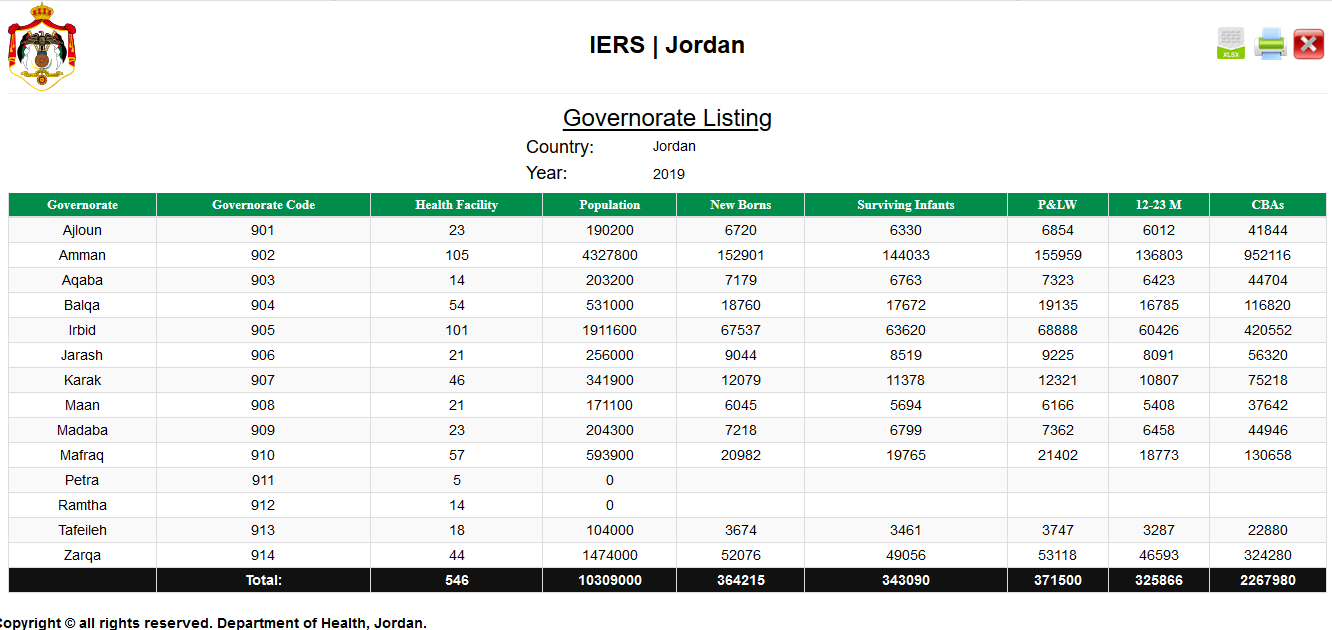
3.2.1 Governorate Listing
The report provide the listing of governorate along with per year population and estimates of newborn, surviving infants, pregnant ladies, children between one to two years and child bearing age women. Following screenshot provides the estimates for years 2020 for each governorate.
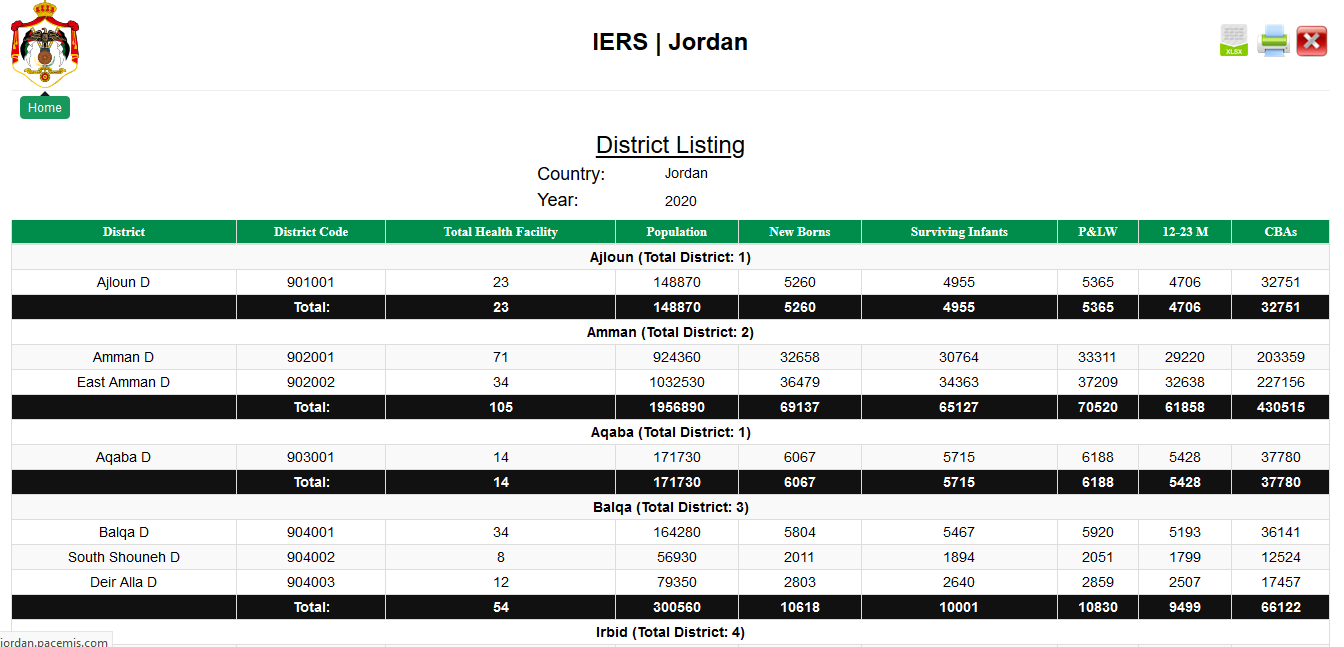
3.2.2 District Listing
The report provide the listing of governorate along with per year population and estimates of newborn, surviving infants, pregnant ladies, children between one to two years and child bearing age women. Following screenshot provides the estimates for years 2020 for each governorate.
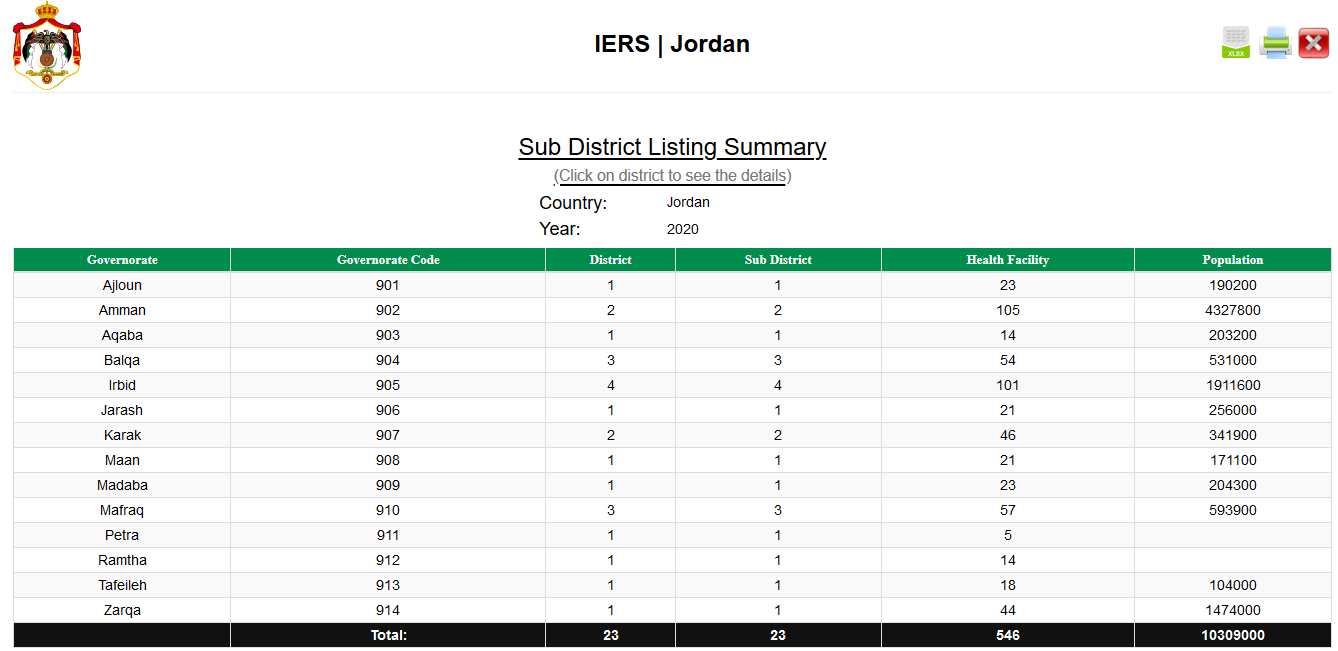
3.2.3 Sub District Listing
The report provide the listing of governorate along with number of districts, sub-districts and health centers. Further drilldown will provide the sub-district listing along with per year population and estimates of newborn, surviving infants, pregnant ladies, children between one to two years and child bearing age women.
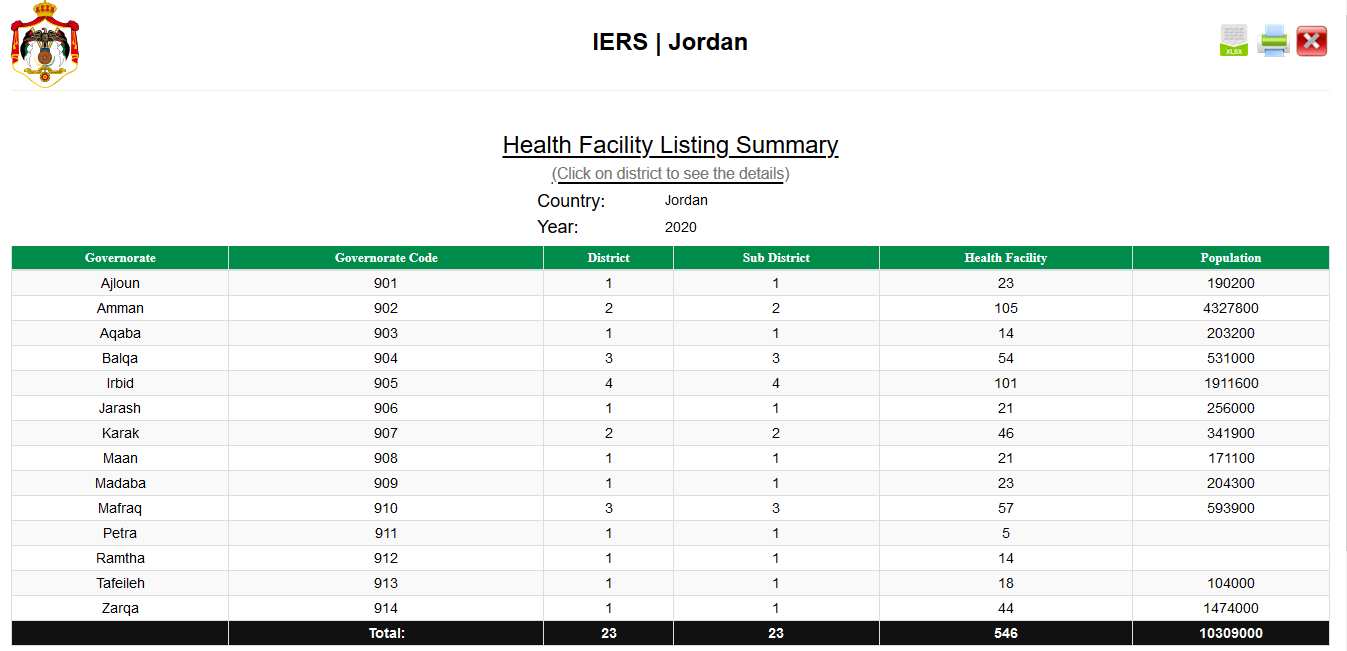
3.2.4. Health Center Listing
The report provide the listing of governorate along with number of districts, sub-districts and health centers. Further drilldown will provide health center listing along with per year population and estimates of newborn, surviving infants, pregnant ladies, children between one to two years and child bearing age women.
3.3 Disease Surveillance
This section provides the line lists, and other reports e.g. age-wise, gender-wise, sex-wise and governorate-wise distribution of diseases cases.
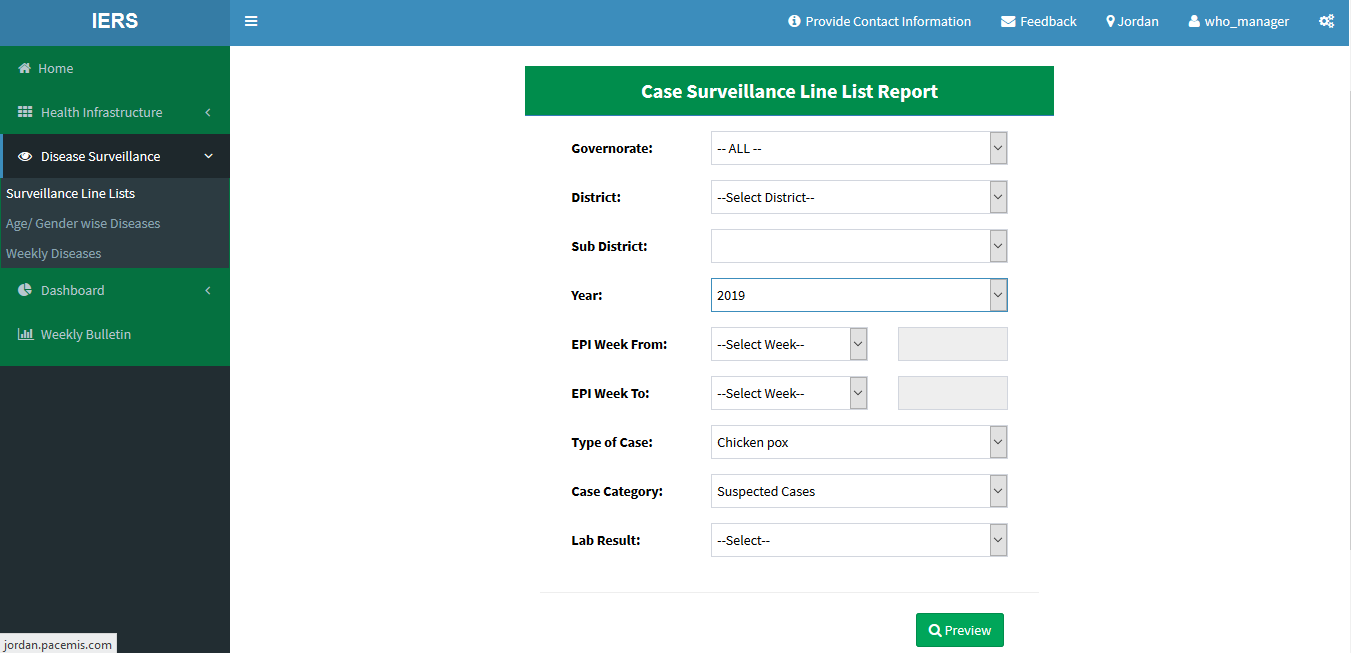
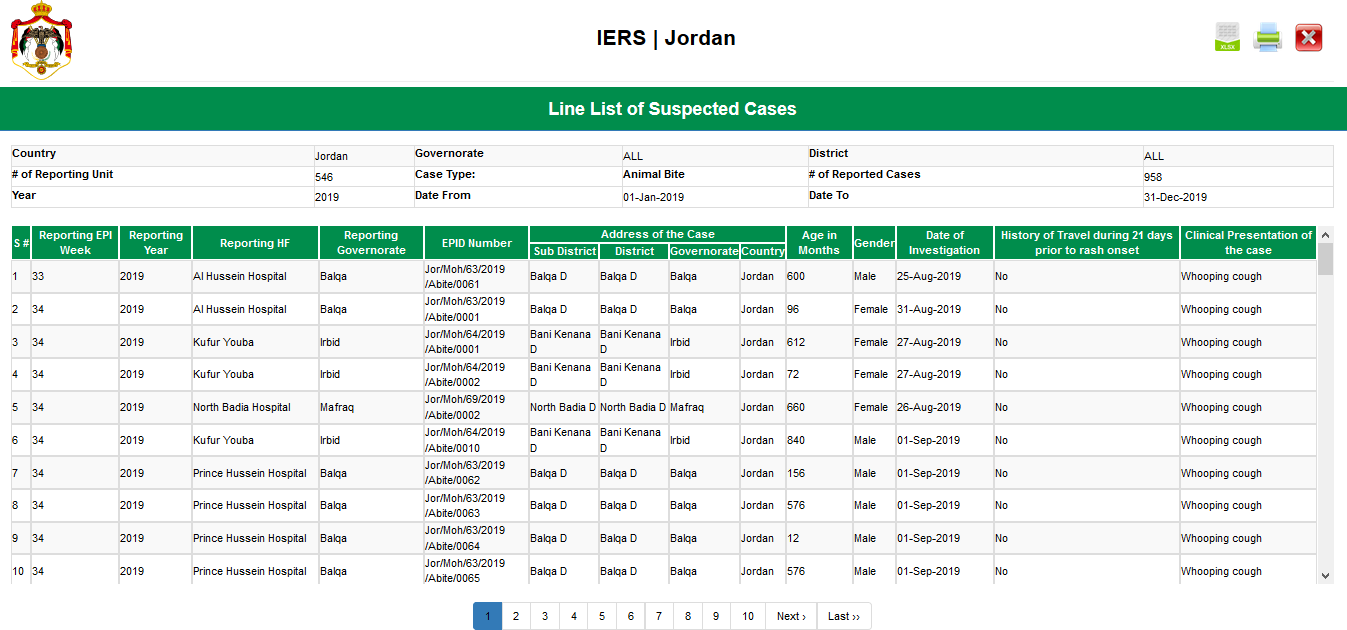
3.3.1 Cases Line lists
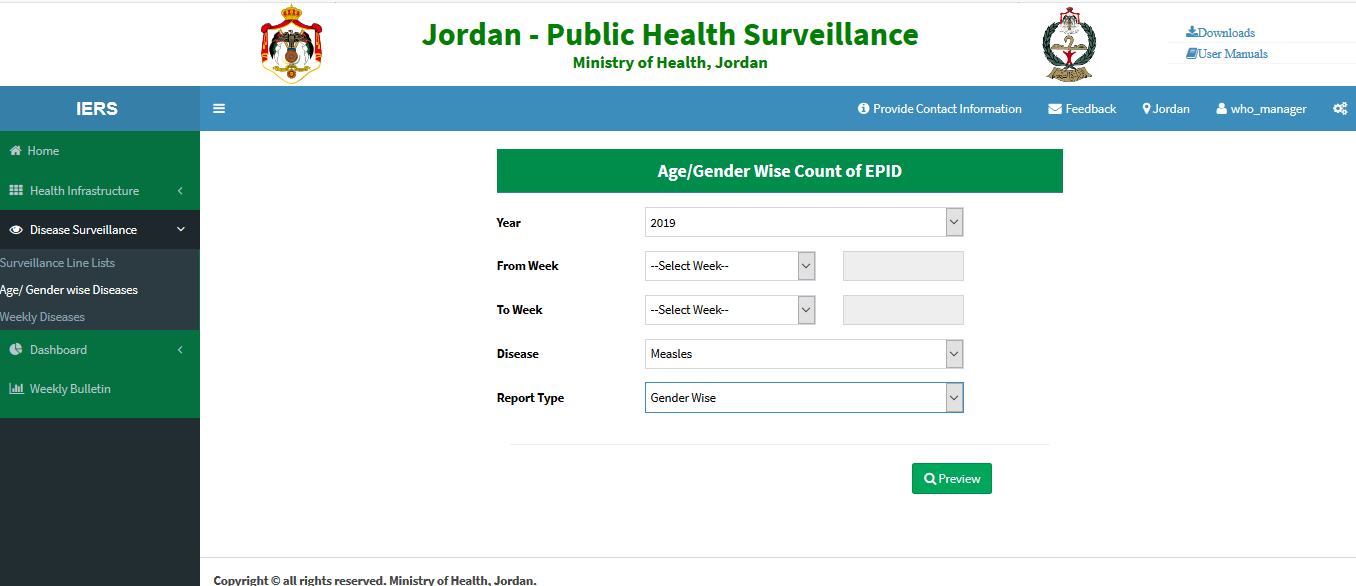
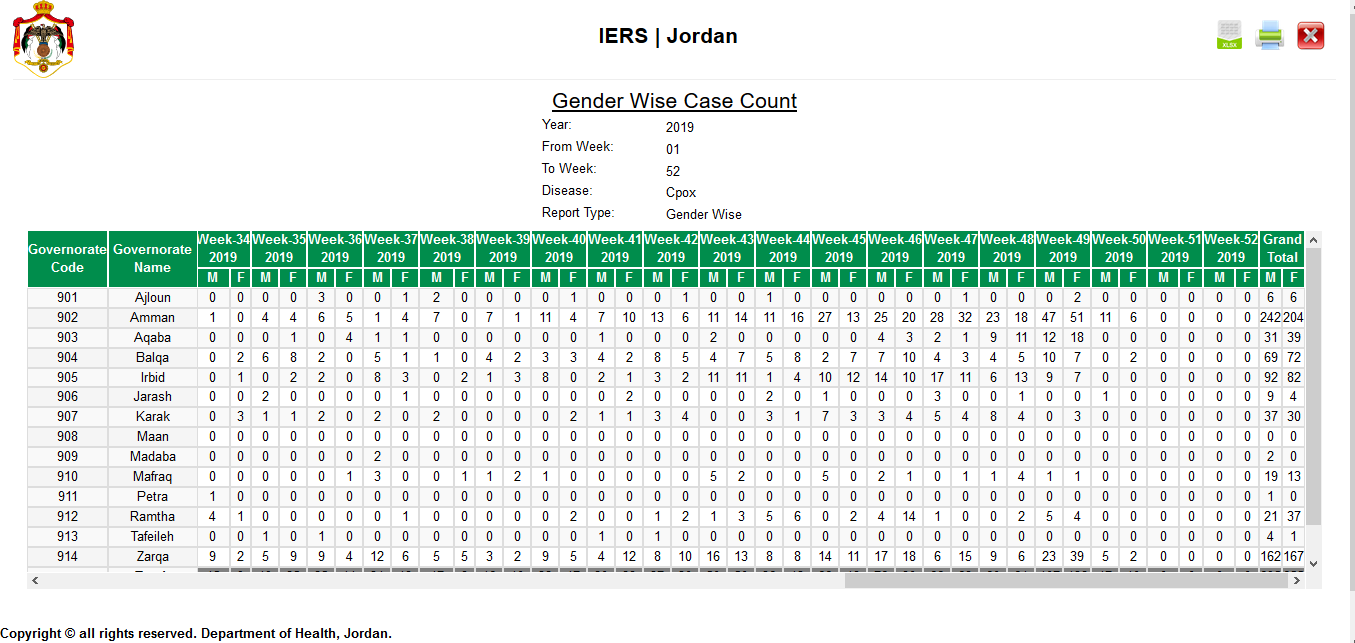
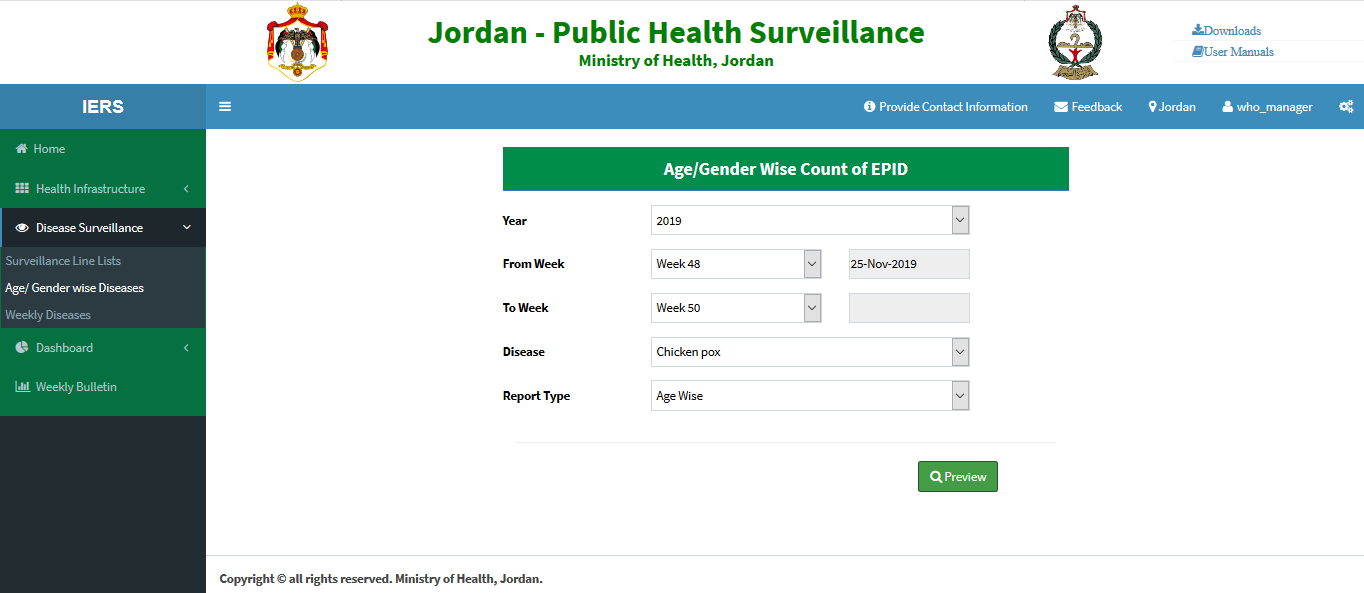
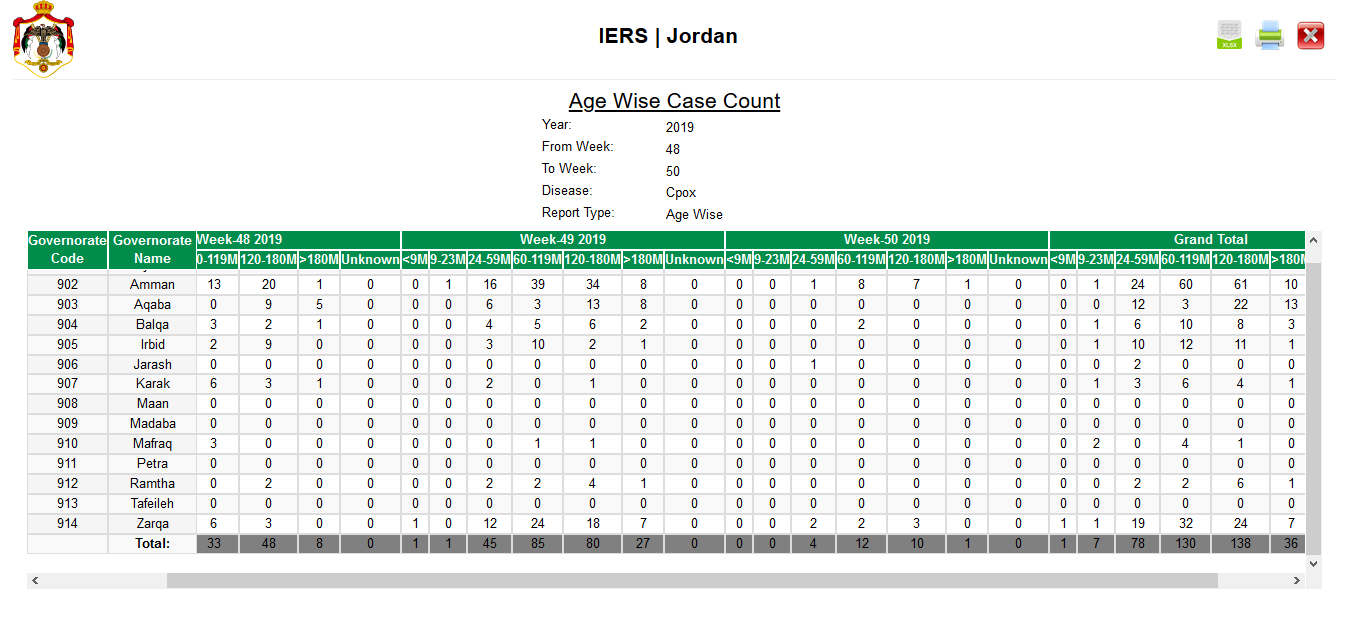
3.3.2 Age / Gender wise Cases
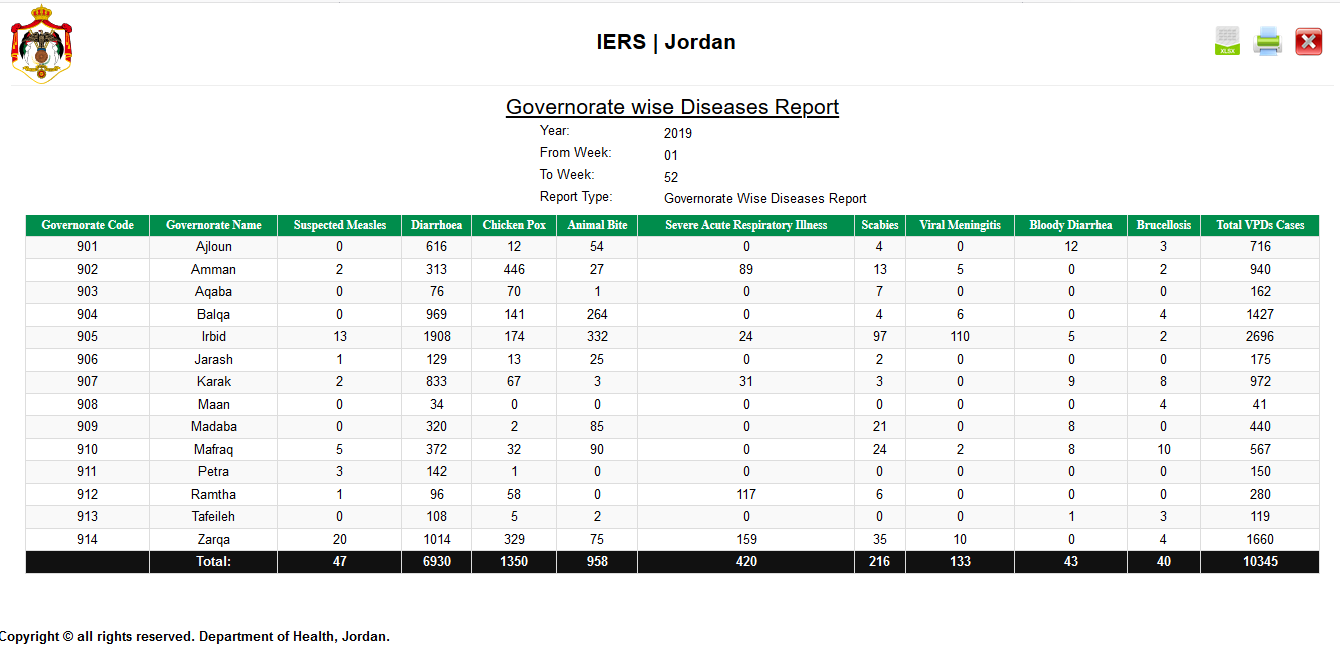
3.3.3 Governorate wise Disease Cases
3.4 Dashboards
The dashboards provide main summary dashboard, geo location of surveillance sites, governorate wise disease incidence and thematic analysis.
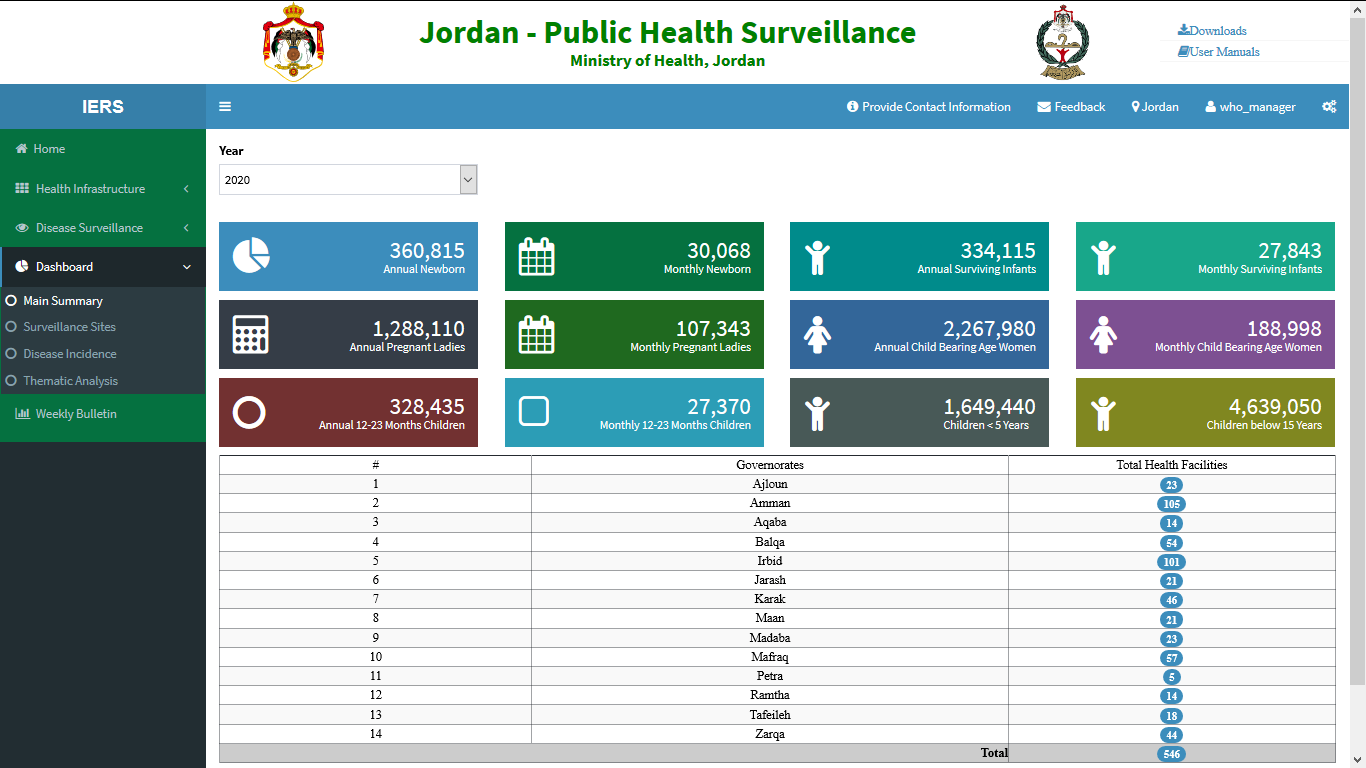
3.4.1 Main Summary
The main summary dashboard provides the annual and monthly estimates of newborns, pregnant ladies and surviving infants. At the bottom, the page also shows the number of health center in each governorate.
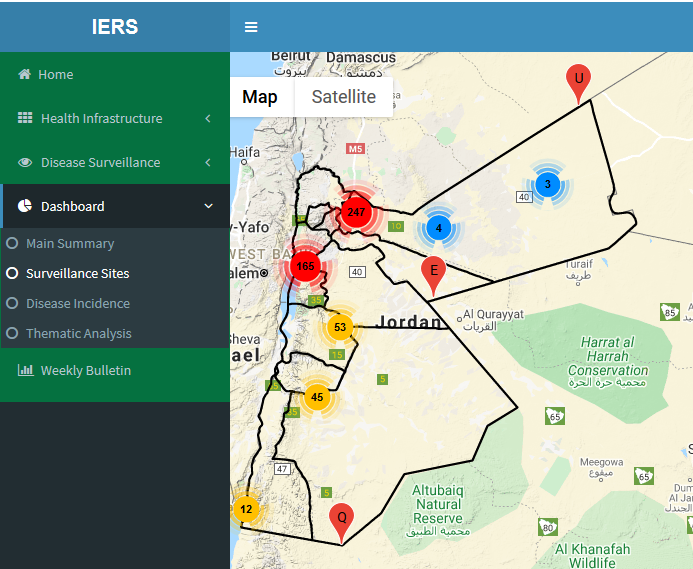
3.4.2 Surveillance Site
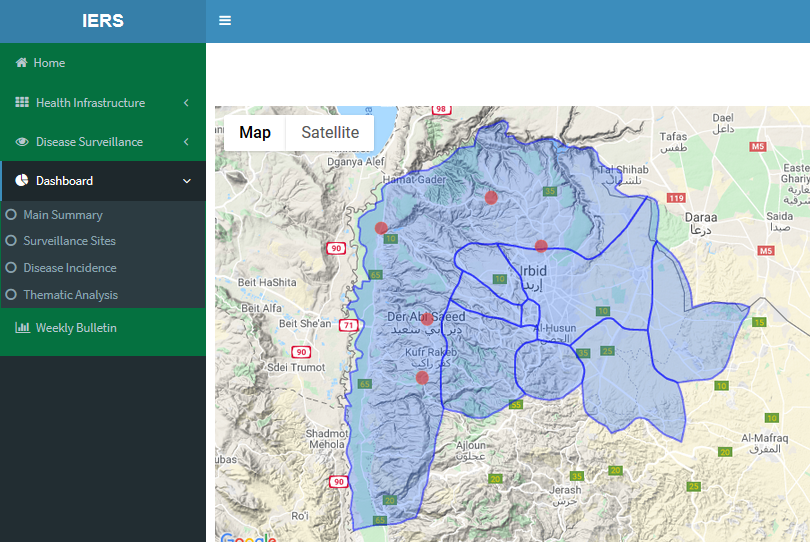
The dashboard shows the total number of health centers in each governorate and the geo coordinates of health centers on the google map.
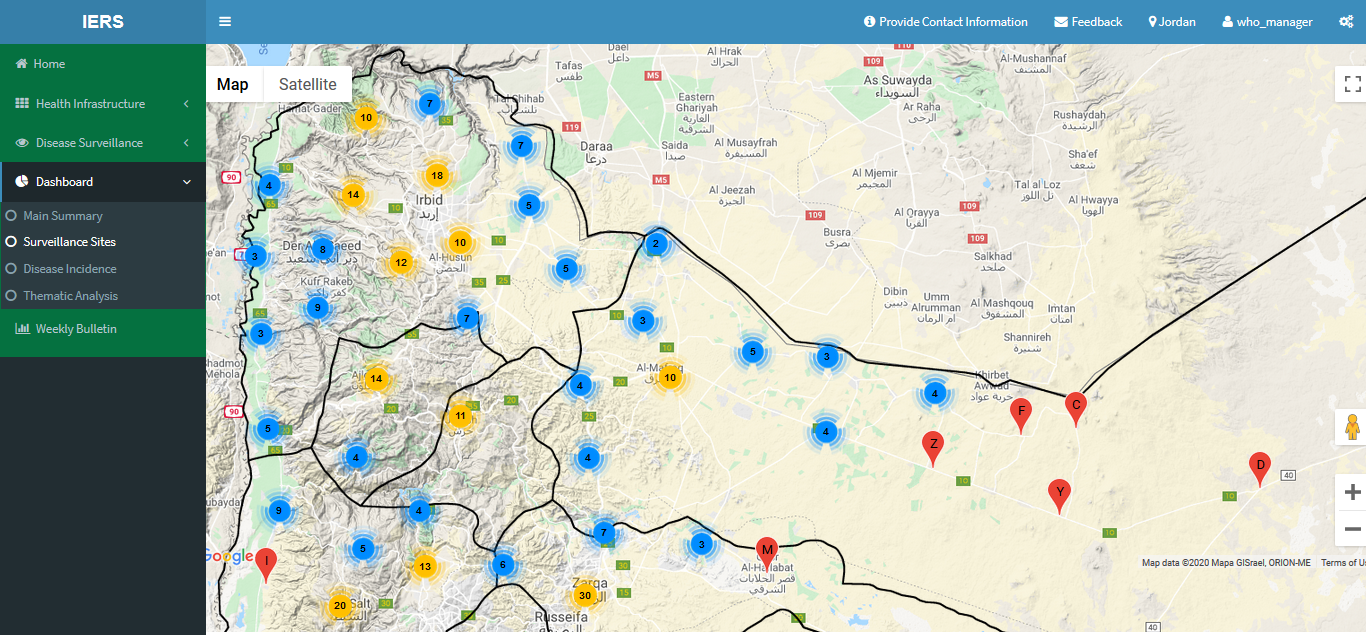
Clicking on any number circle is further zoom and provide the number of the health centers in different districts.
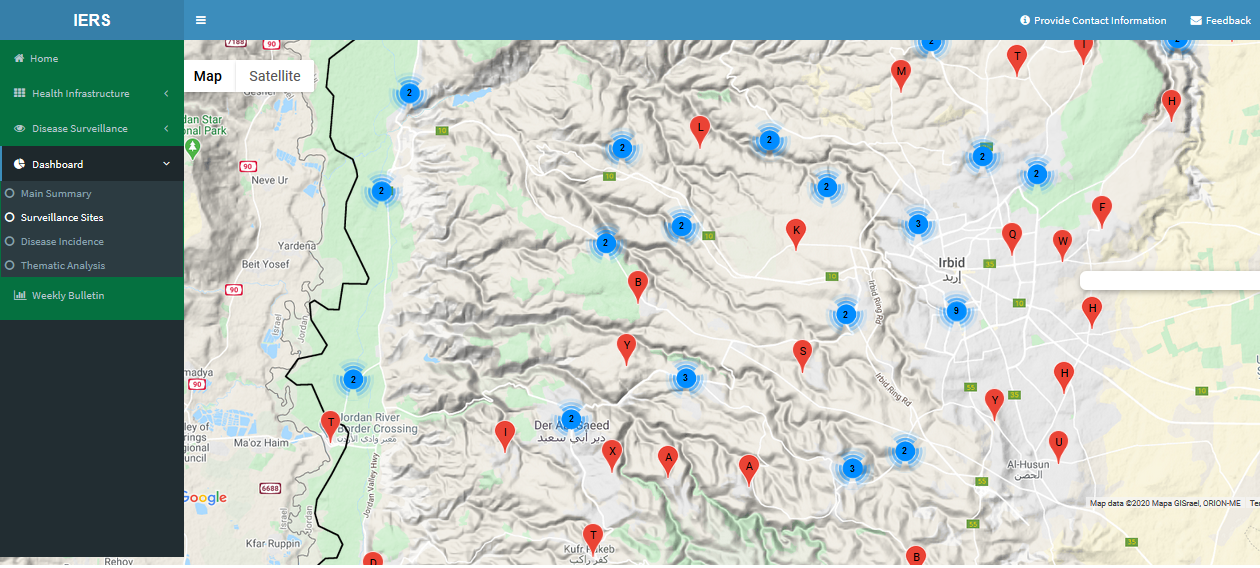
Further clicking on any number circle provides the geo location of health centers.
3.4.3 Disease Incidence
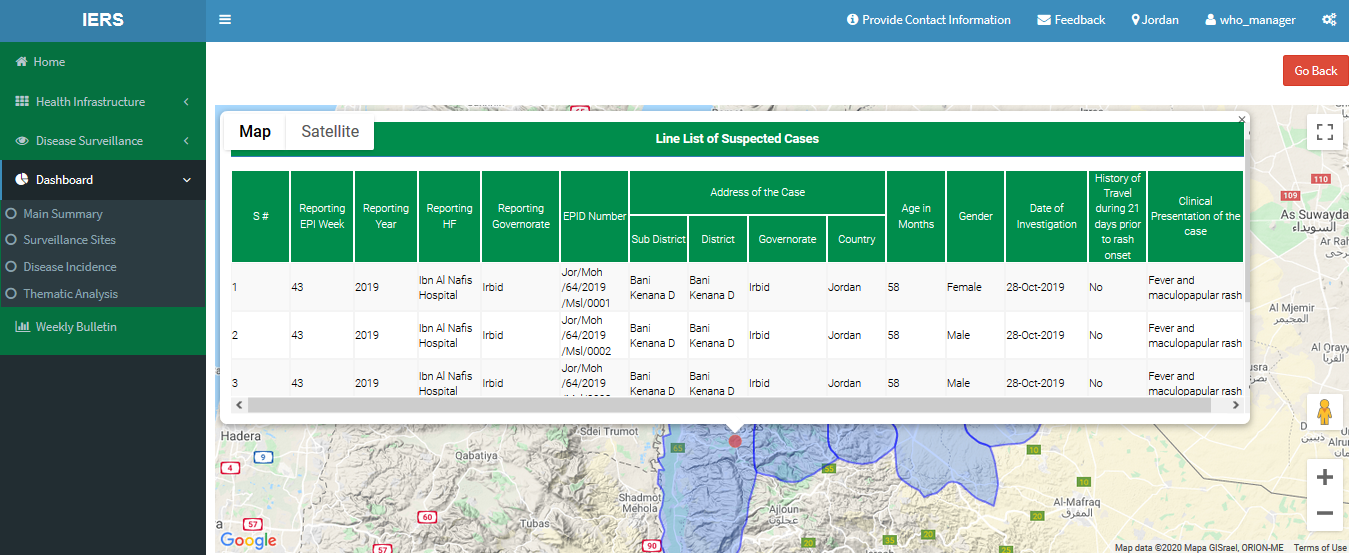
The dashboard provides governorate wise disease burden, dark red color shows more of disease cases and blue color depict zero case. The disease could be selected from the top dropdown and clicking the submit button.
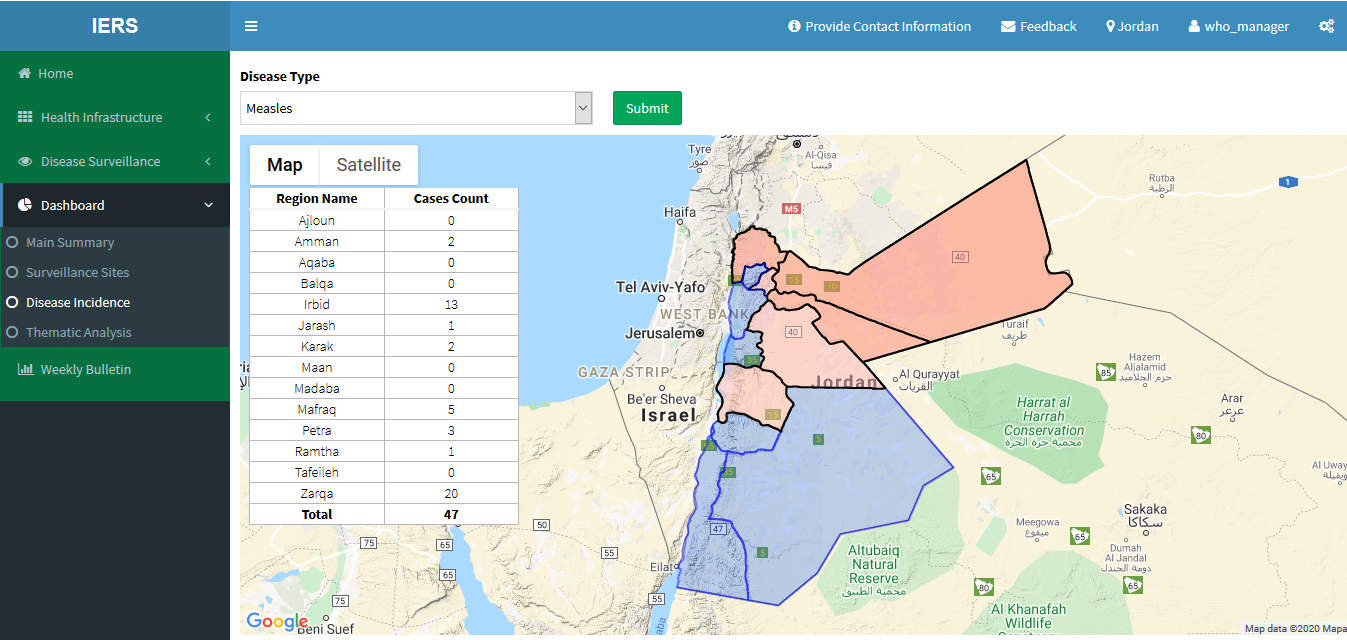
Further drilldown mentioned the health centers where the cases were diagnosed.
If user clicks on any red spot, disease line list will be appeared as follows.
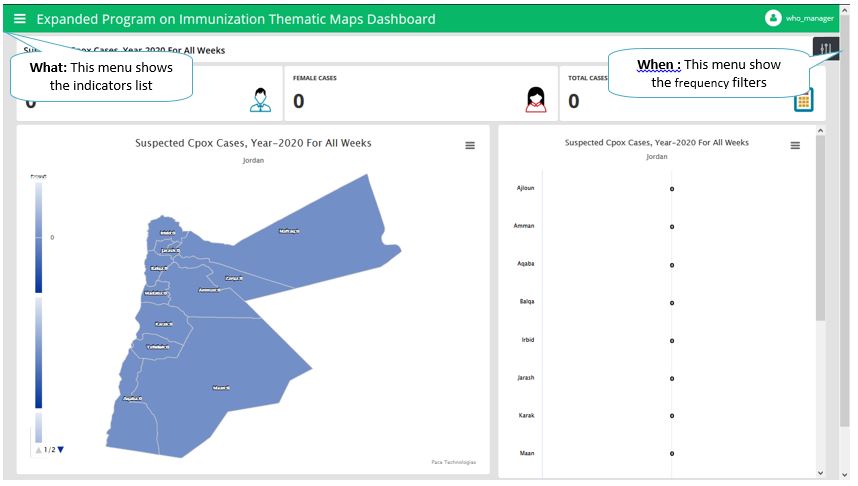
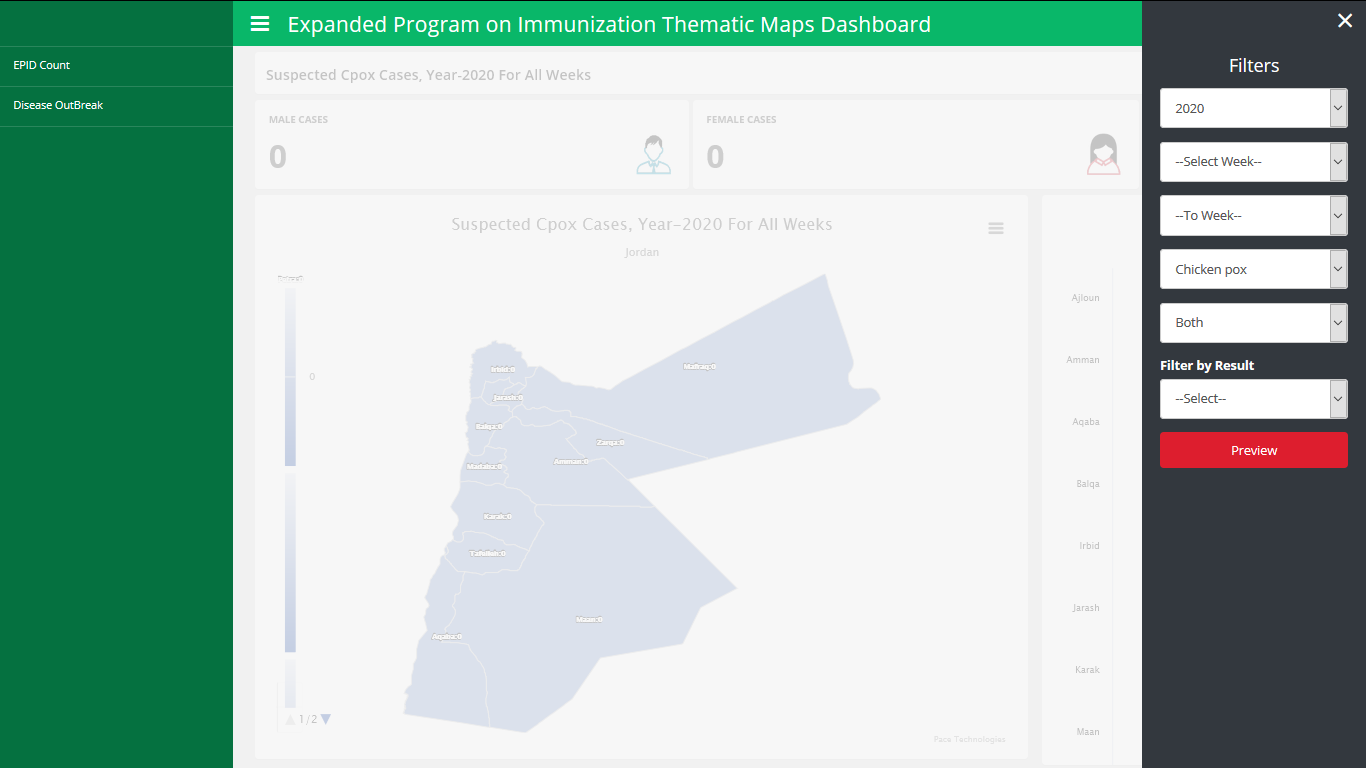
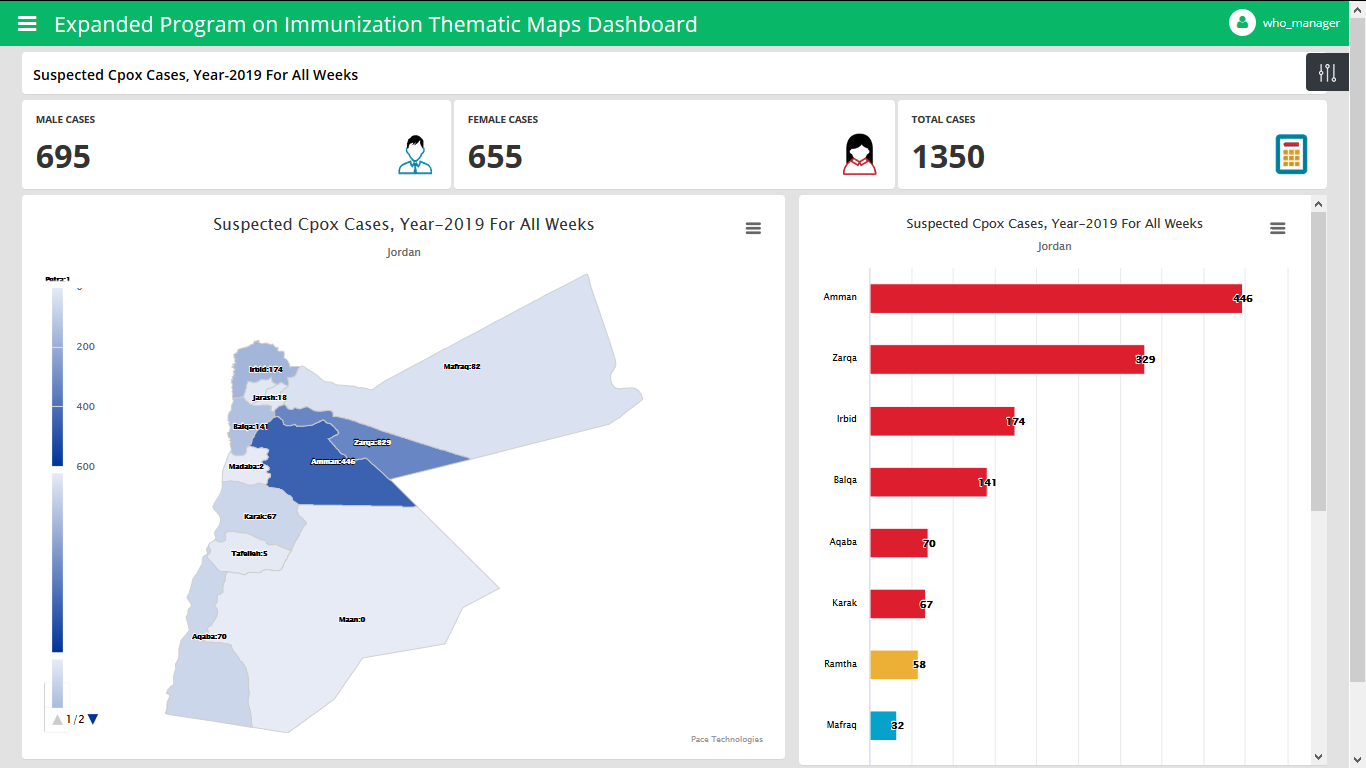
3.4.4 Thematic Analysis
The thematic analysis show the numbers cases and outbreak alerts of the diseases. The left pan shows the ranking of district per diseases, the right pan shows colors according to the disease burden and to icons shows male/female bifurcation of disease.
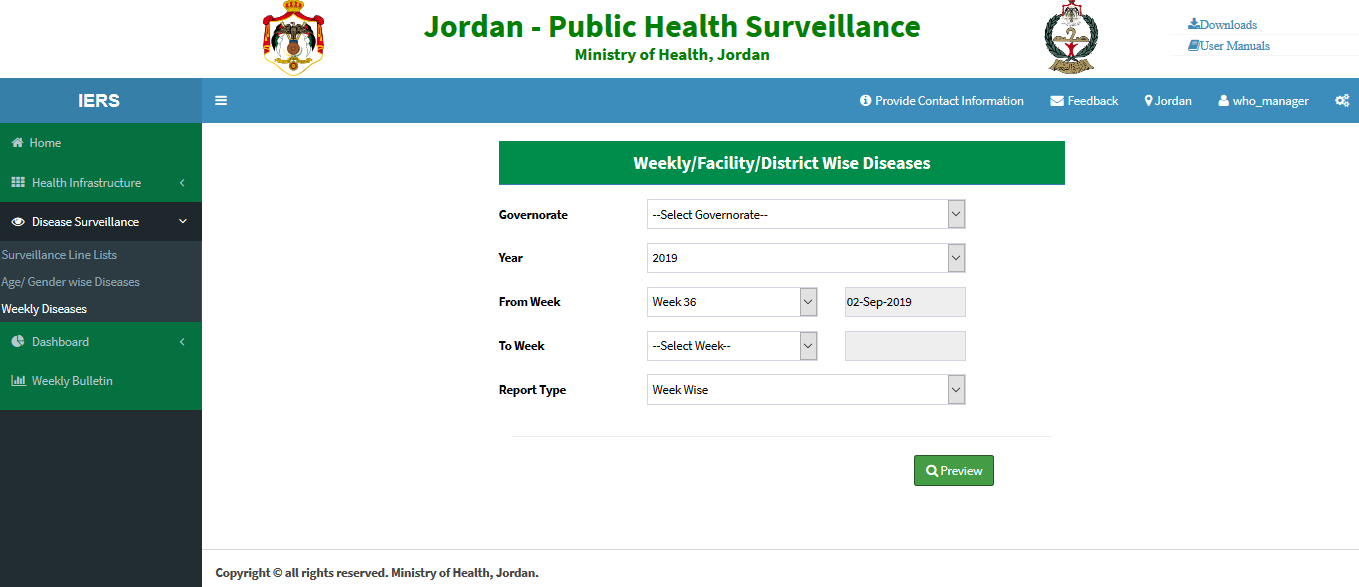
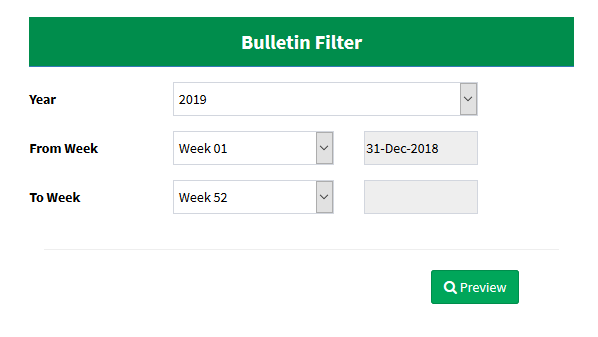
3.5 Weekly Bulletin
1. Go to main menu on the left and click on Weekly Bulletin.
2. The below shown interface will open.
3. It has two filters (Year and Week).
4. Select year and week from their respective filters.
5. For current year, week will show up to current week (no future weeks in filter for current year).
6. For previous year all 52 weeks will appear in the week dropdown.
7. After selecting year and week, click on the Preview button to view the bulletin as show in next pages.
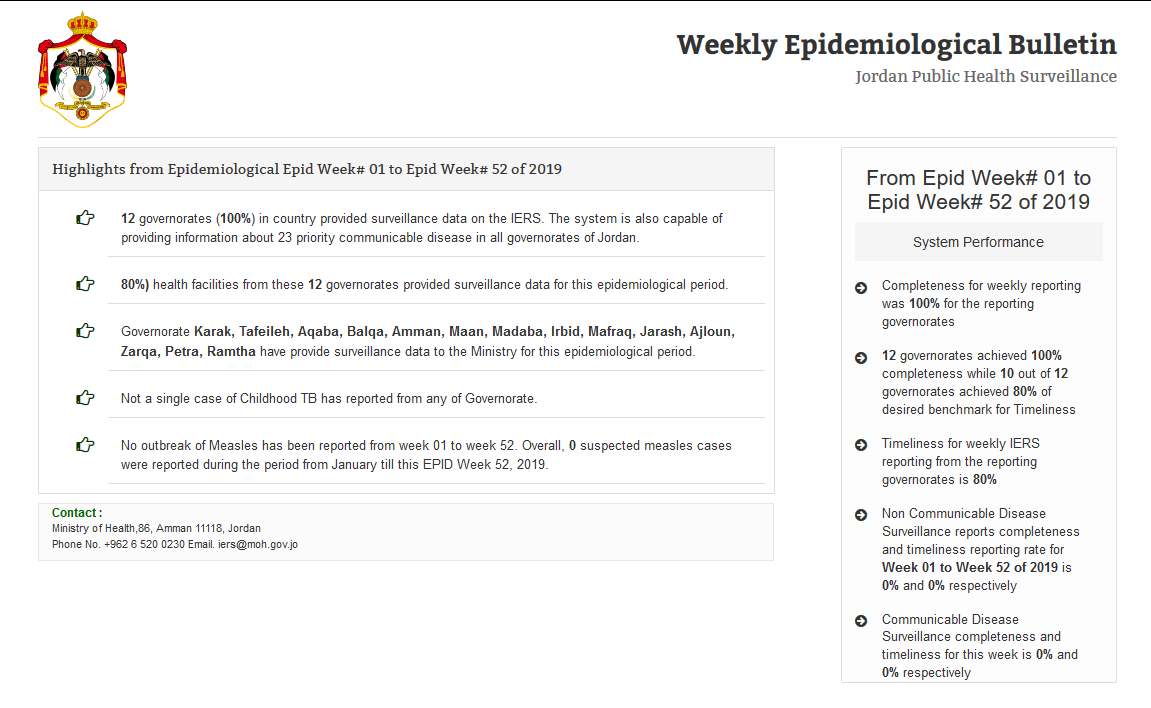
3.5.1 Information on the Bulletin
The weekly bulletin has information divided into four parts.
1 Highlights of Epidemiological EPID Week
2 Weekly Zero Reporting (AEFI & VPD Surveillance) - Completeness & Timeliness
3 District-wise Distribution of VPDs
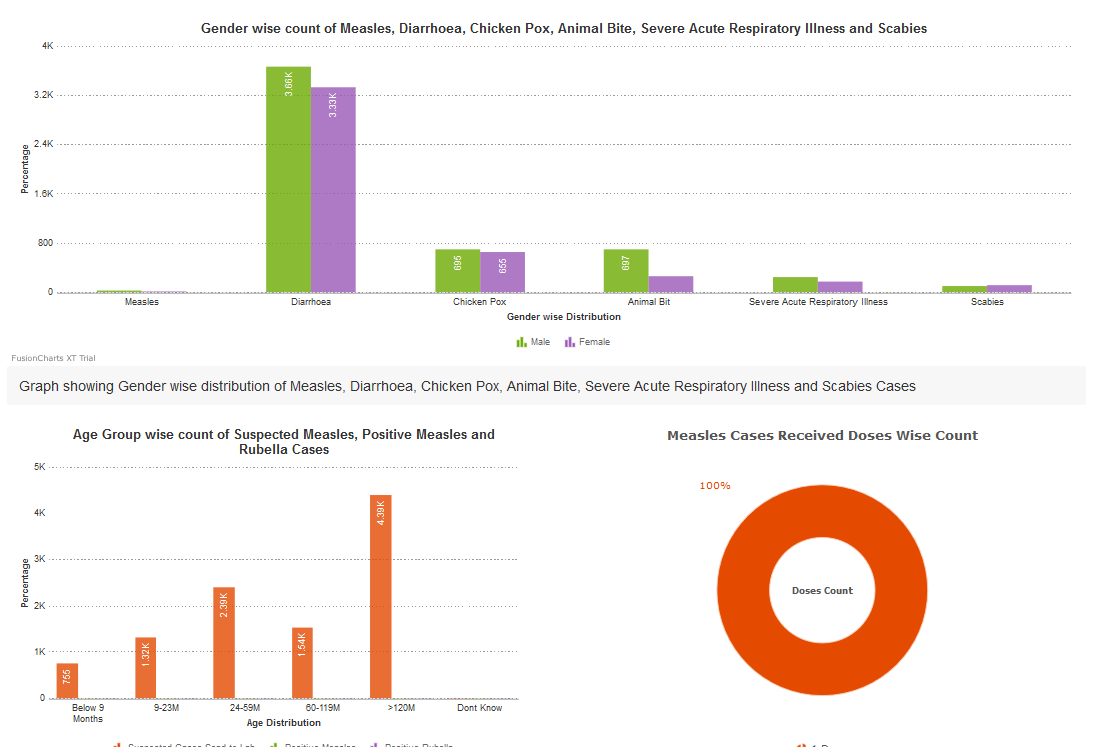
4 Age Wise Distribution of Suspected Cases, Lab Confirmed Cases and Vaccination Status of Suspected Cases
Note: Please turn on to the next pages for screenshots and details
3.5.2 Highlights of Epidemiological EPID Week
1. This part shows the highlights of the EPID Week.
2. It shows the week number, start and end day, month and year of that week.
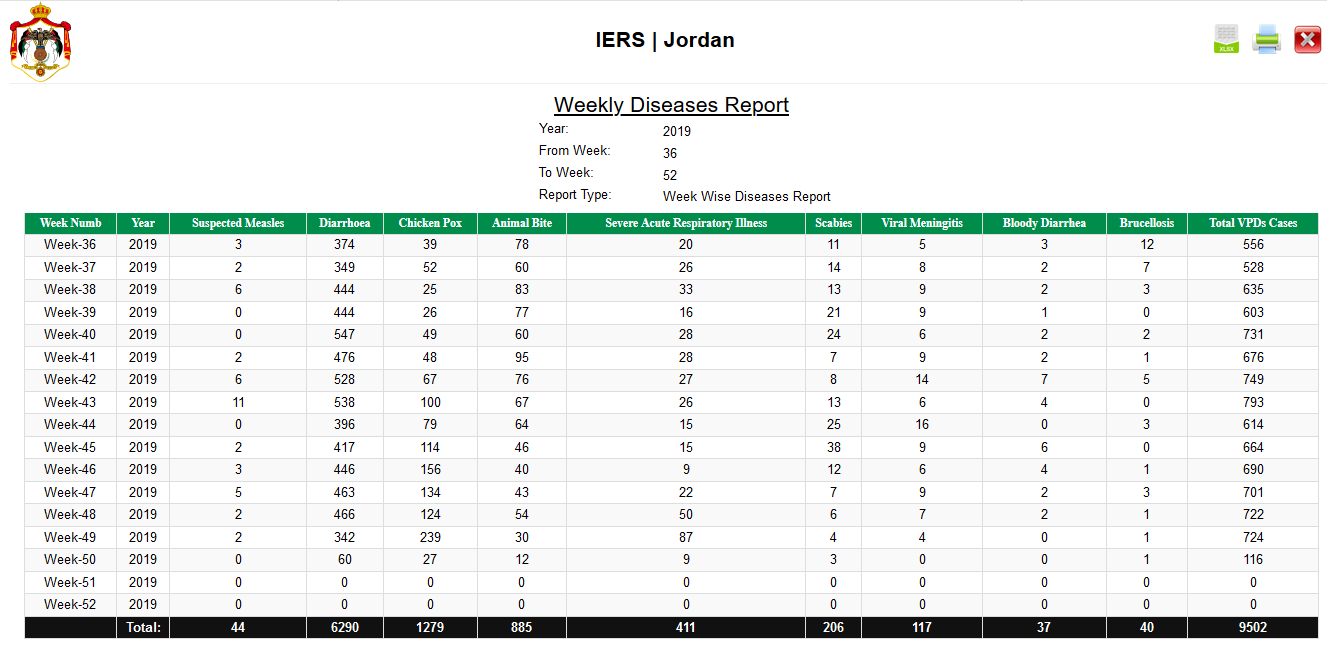
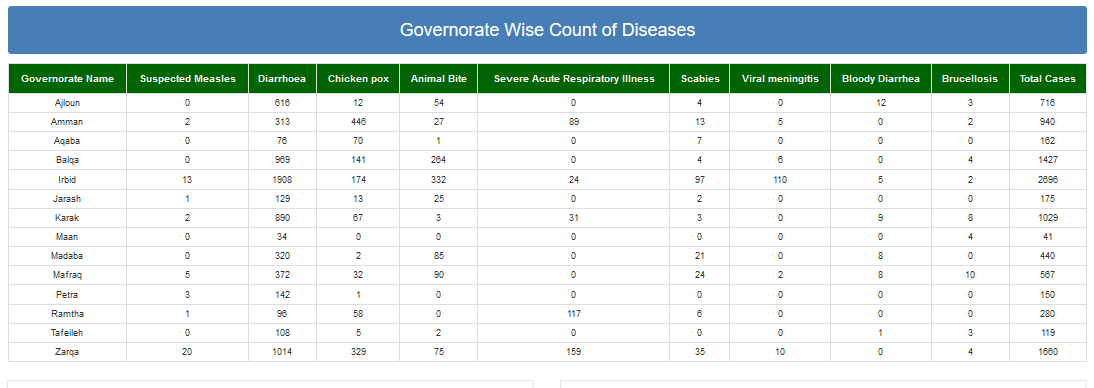
3.5.3 Governorate-Wise Distribution of Disease
1. This section has a table showing district-wise data of diseases.
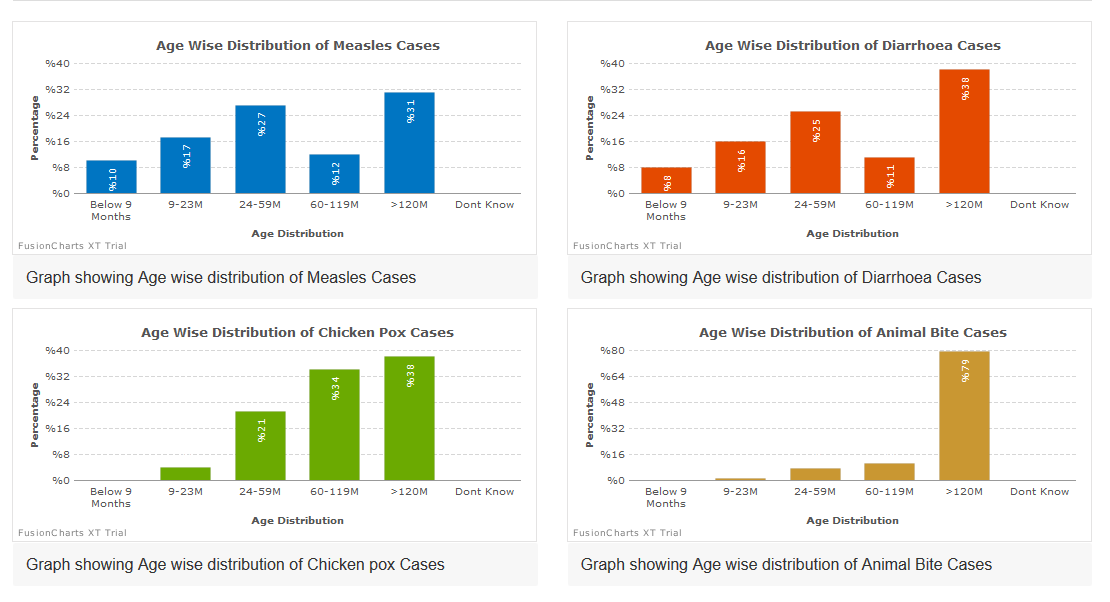
3.5.4 Age Wise Distribution of Suspected Cases
1. This sections shows graphs with information about age wise distribution of suspected cases.
2. Age distribution is shown horizontally from left to right (x-axis) while percentage is shown vertically from bottom to top (y-axis).